Monitoring Best Practices for Exadata Database Service on AWS Cloud
- Aug 28, 2025
- 3 min read
Updated: Jan 29
Oracle’s Exadata Database Service on AWS integrates the power of Oracle Exadata with AWS infrastructure. To keep it running at peak efficiency and reliability, robust monitoring plays a key role. Here's a comprehensive technical guide on how to monitor this service effectively.

Oracle Console / OEM provides in-depth Exadata-specific metrics like Smart Flash Cache efficiency
and offload operations. Oracle Cloud Infrastructure Monitoring service
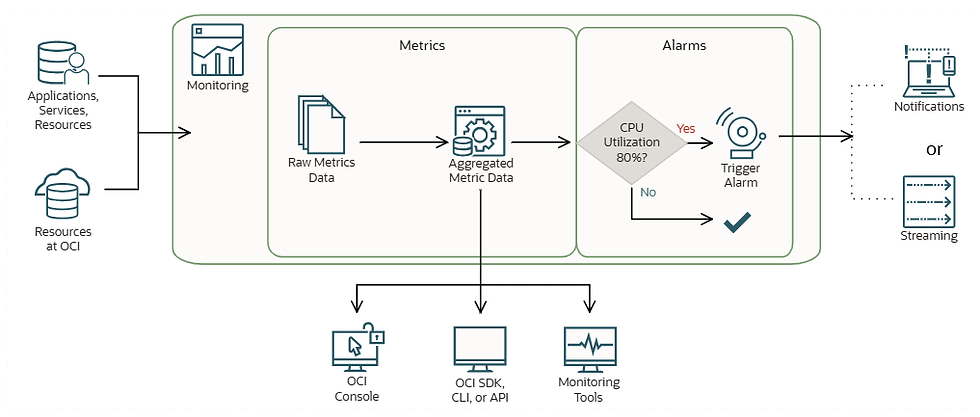
AWS CloudWatch captures essential infra-level metrics and can trigger alarms for thresholds.
Go through in detail
1.Metrics Collection & Monitoring Tools
Metric Category | What to Monitor | Tools & Integration |
Compute & Storage | CPU, memory, I/O, disk usage, latency | AWS CloudWatch + Oracle Service Console for metrics |
Database Health | Sessions, buffer cache, PGA/SGA utilization | Oracle Database Enterprise Manager / AWR |
Exadata Insights | Smart Scan offload, SmartFlash, I/O latencies | Oracle Enterprise Manager (OEM) / OEM Cloud Control |
Detailed Monitoring Metrics Table for Exadata Database Service on AWS
Metric Category | Key Metrics | Monitoring Tools (OCI & AWS) | Proactive Benefit / Issue Mitigation |
Compute (CPU/Memory) | CPU utilization, memory usage, CPU steal time | AWS CloudWatch, OEM, Exadata console, OCI Monitoring | Detect resource exhaustion early to avoid node crashes or degraded performance |
Storage I/O | Read/write IOPS, throughput, disk latency, ASM usage | AWS CloudWatch, Oracle ASM views, Exadata Metrics | Prevent slow queries or data corruption due to high latency or disk saturation |
Exadata Smart Features | Smart Scan offload %, Smart Flash Cache hit rate, storage cell CPU usage | Oracle Enterprise Manager (OEM), Exadata CLI | Identify underutilization of Exadata features and tune workloads accordingly |
Database Sessions | Active sessions, blocked sessions, session wait events | OEM, AWR/ASH reports, OCI Monitoring (via agent) | Detect blocking sessions, deadlocks, or concurrency issues before outages |
Backup & Recovery | RMAN job status, backup duration, FRA usage | OEM, Exadata Console, OCI Logging | Ensure backup success and avoid recovery failure during disaster |
Network | Network in/out, TCP retransmits, DNS latency | AWS CloudWatch, VPC Flow Logs, OCI VCN Monitoring | Identify network bottlenecks or latency issues affecting app-DB communication |
Database Wait Events | Buffer busy waits, log file sync, db file sequential read | AWR/ASH reports, OEM | Proactively tune queries and I/O systems before performance degrades |
Security & Access | Failed login attempts, privilege escalations, IAM role usage | AWS CloudTrail, OCI Audit, Oracle Audit Vault | Detect security breaches or unusual access patterns early |
Patching & Versioning | Patch status, software version, known vulnerabilities | OEM, dba_registry_history, OCI Resource Manager | Ensure up-to-date systems to prevent bugs and known exploits |
Cluster & HA | Node up/down status, cluster heartbeat, failover readiness | OEM, CRSCTL, Exadata Health Checks | Detect and recover from node or service failures before they impact users |
2. Setting Up Alerting & Notifications
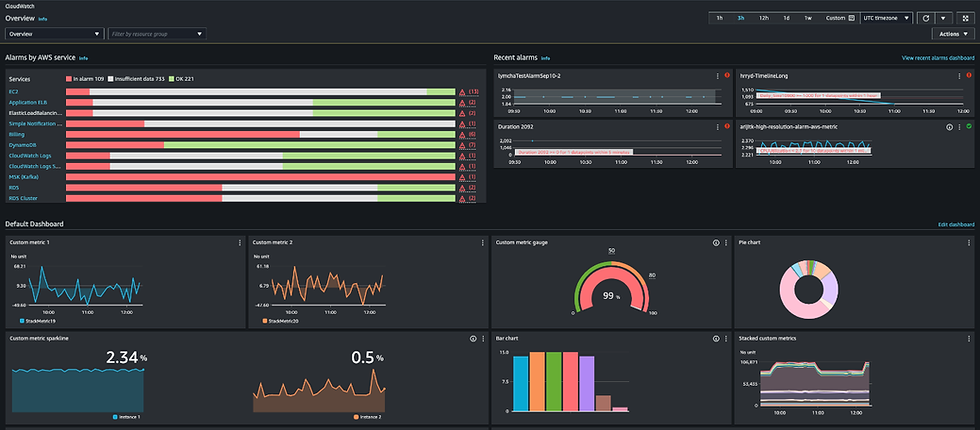
Define alarms in CloudWatch for metrics such as CPU > 80%, disk latency > 5ms, or high IOPS.
In the Oracle Console, configure thresholds for Exadata-related metrics (e.g., Smart Scan offload rate).
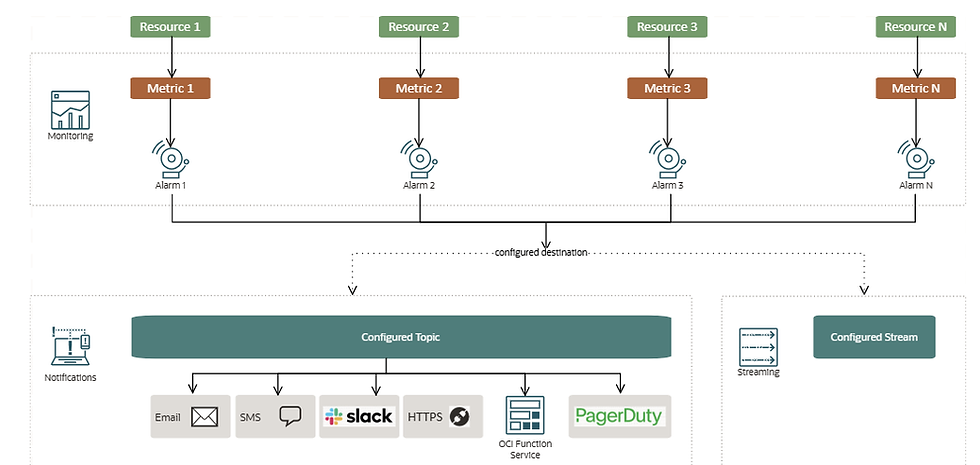
Forward alerts to SNS, email, or pager services.
Optionally, integrate with ticketing systems (e.g., ServiceNow, JIRA) via webhook.
3. Real-Time Alerts for Critical Events
Use Oracle Cloud Infrastructure’s Events feature to detect Exadata node failures or storage anomalies.
Trigger automation scripts (via Lambda or OCI Functions) to create support tickets or remediate issues.
Review alerts regularly with dashboard visibility and proactive incident response.
4. Trending & Capacity Planning
Use historical CloudWatch metrics and OEM to:
Track CPU usage growth
Monitor query performance trends
Detect I/O patterns during peak loads
Generate forecasts and schedule scale-up/scale-down actions for CPU, memory, or disk resource changes.
5. Operational Best Practices
Enable SQL monitoring and review AWR/ASH for slow query optimization.
Periodically test backup & recovery logs.
Validate critical Exadata alerts and resource usage thresholds every quarter or after major upgrades.
Conduct regular maintenance using OEM to clean up old AWR snapshots and archive logs.
Summary: Why Comprehensive Monitoring Matters
Ensures Performance & Reliability
Early detection of spikes and anomalies prevents downtime and resource bottlenecks.
Enables Proactive Management
Scheduled scaling and capacity forecasting eliminate surprises during high-demand periods.
Optimizes Resource Usage
Insights into cache efficiency and query patterns help fine-tune performance and reduce costs.
Quick-Start Checklist
Enable CloudWatch monitoring for EC2, storage, and network.
Log into Oracle Cloud Console/OEM and activate key metric alerts.
Set adaptive thresholds for offload and latency events.
Configure alerting downstream to on-call teams or ticketing systems.
Review dashboards weekly and plan monthly capacity check-ins.
Reference links:


Comments